"Kaplan-Meier curves remain a key method for analyzing survival data in clinical studies, and are also an important tool in high-throughput biology research." - Dr. John Quackenbush
Kaplan-Meier curves are a widely used method in survival analysis, particularly in clinical trials and epidemiology research. However, they are also an essential tool in computational biology research, especially when analyzing high-throughput data such as gene expression and sequencing data. In this blog post, we will discuss what Kaplan-Meier curves are, how they are used in computational biology research, and why they are important.
What are Kaplan-Meier curves?
Kaplan-Meier curves are a graphical representation of survival data that illustrate the probability of an event occurring over time. The event of interest can be anything from death to disease recurrence, and the data can come from a variety of sources, such as clinical trials or observational studies. The Kaplan-Meier curve is a stepwise function that shows the cumulative probability of surviving without the event of interest at each time point. The curve is calculated by dividing the number of individuals who have not experienced the event of interest by the total number of individuals at risk at each time point.
How are Kaplan-Meier curves used in computational biology research?
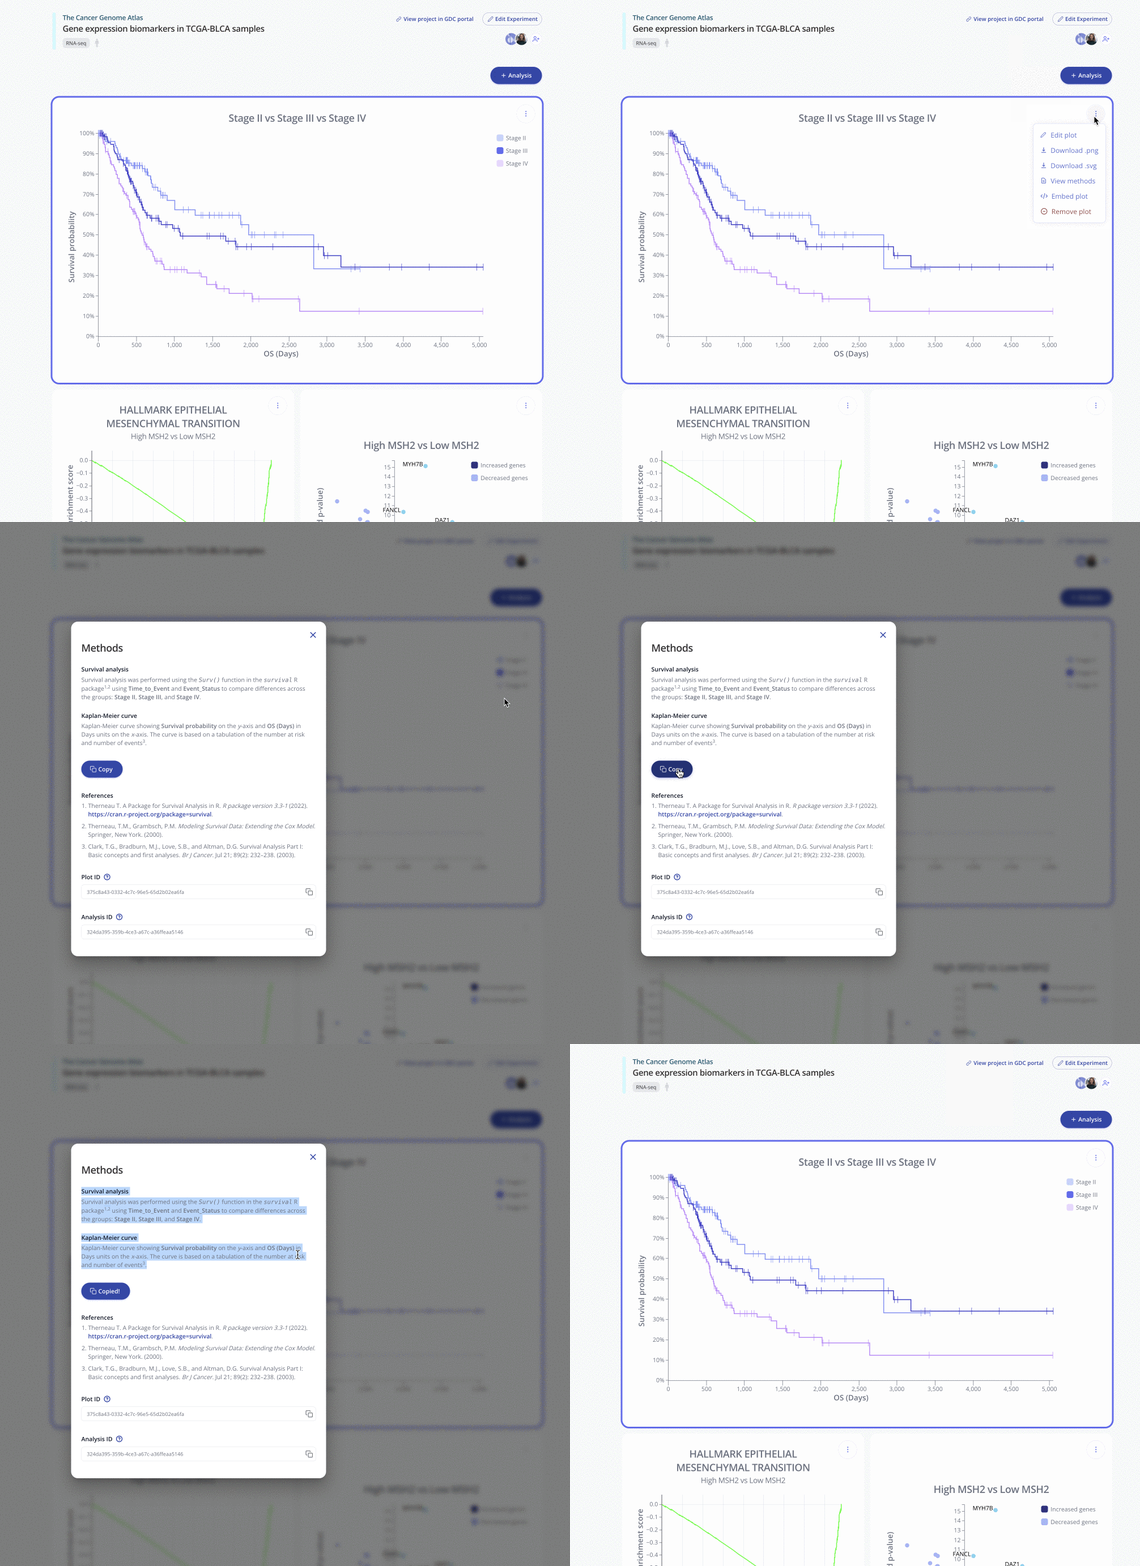
In computational biology research, Kaplan-Meier curves are commonly used to analyze survival data in various contexts. For example, they can be used to analyze the survival of cancer patients based on gene expression patterns or to compare the survival of patients with different genetic mutations. Multiple conditions can be visualized in one graph, allowing comparison of patterns in early and late stages of cancer. Kaplan-Meier curves can also be used to analyze the survival of organisms under different conditions, such as exposure to drugs or environmental stressors.
In addition, Kaplan-Meier curves can be used in gene set enrichment analysis (GSEA), a computational method used to identify groups of genes that are differentially expressed between different experimental conditions. In GSEA, Kaplan-Meier curves are used to assess whether the expression of a gene set is significantly associated with survival. This approach can identify biologically relevant gene sets that are associated with particular phenotypes or conditions.
Why are Kaplan-Meier curves important in computational biology research?
Kaplan-Meier curves are an essential tool in computational biology research because they allow researchers to analyze survival data and identify patterns and relationships that would otherwise be difficult to detect. Interactions between genes can be investigated by plotting survival curves with different expression levels of the genes on the same plot. By visualizing survival data over time, Kaplan-Meier curves can reveal information about the efficacy of treatments, the progression of diseases, and the impact of genetic or environmental factors on survival.
Moreover, Kaplan-Meier curves are particularly useful in high-throughput data analysis, such as gene expression and sequencing data. They allow researchers to compare survival rates of different groups of patients over time. Therefore, this allows the identification of important genes or pathways that are associated with specific traits or diseases. In addition, Kaplan-Meier curves can be used to validate the results of other computational analyses, such as clustering or classification methods.
Methods to create a Kaplan-Meier curve plot
There are several methods to create a Kaplan-Meier curve plot. Here are three commonly used methods:
-
Using statistical software: Statistical software such as R or SAS can be used to create Kaplan-Meier curves. These software packages have built-in functions for generating them and can handle large datasets, with multiple genes. To create a Kaplan-Meier curve using R, for example, you can use the survival package, which provides functions for fitting and plotting Kaplan-Meier curves. Ensure that your data has columns with time data, and patient survival data as variables for the functions in the package.
-
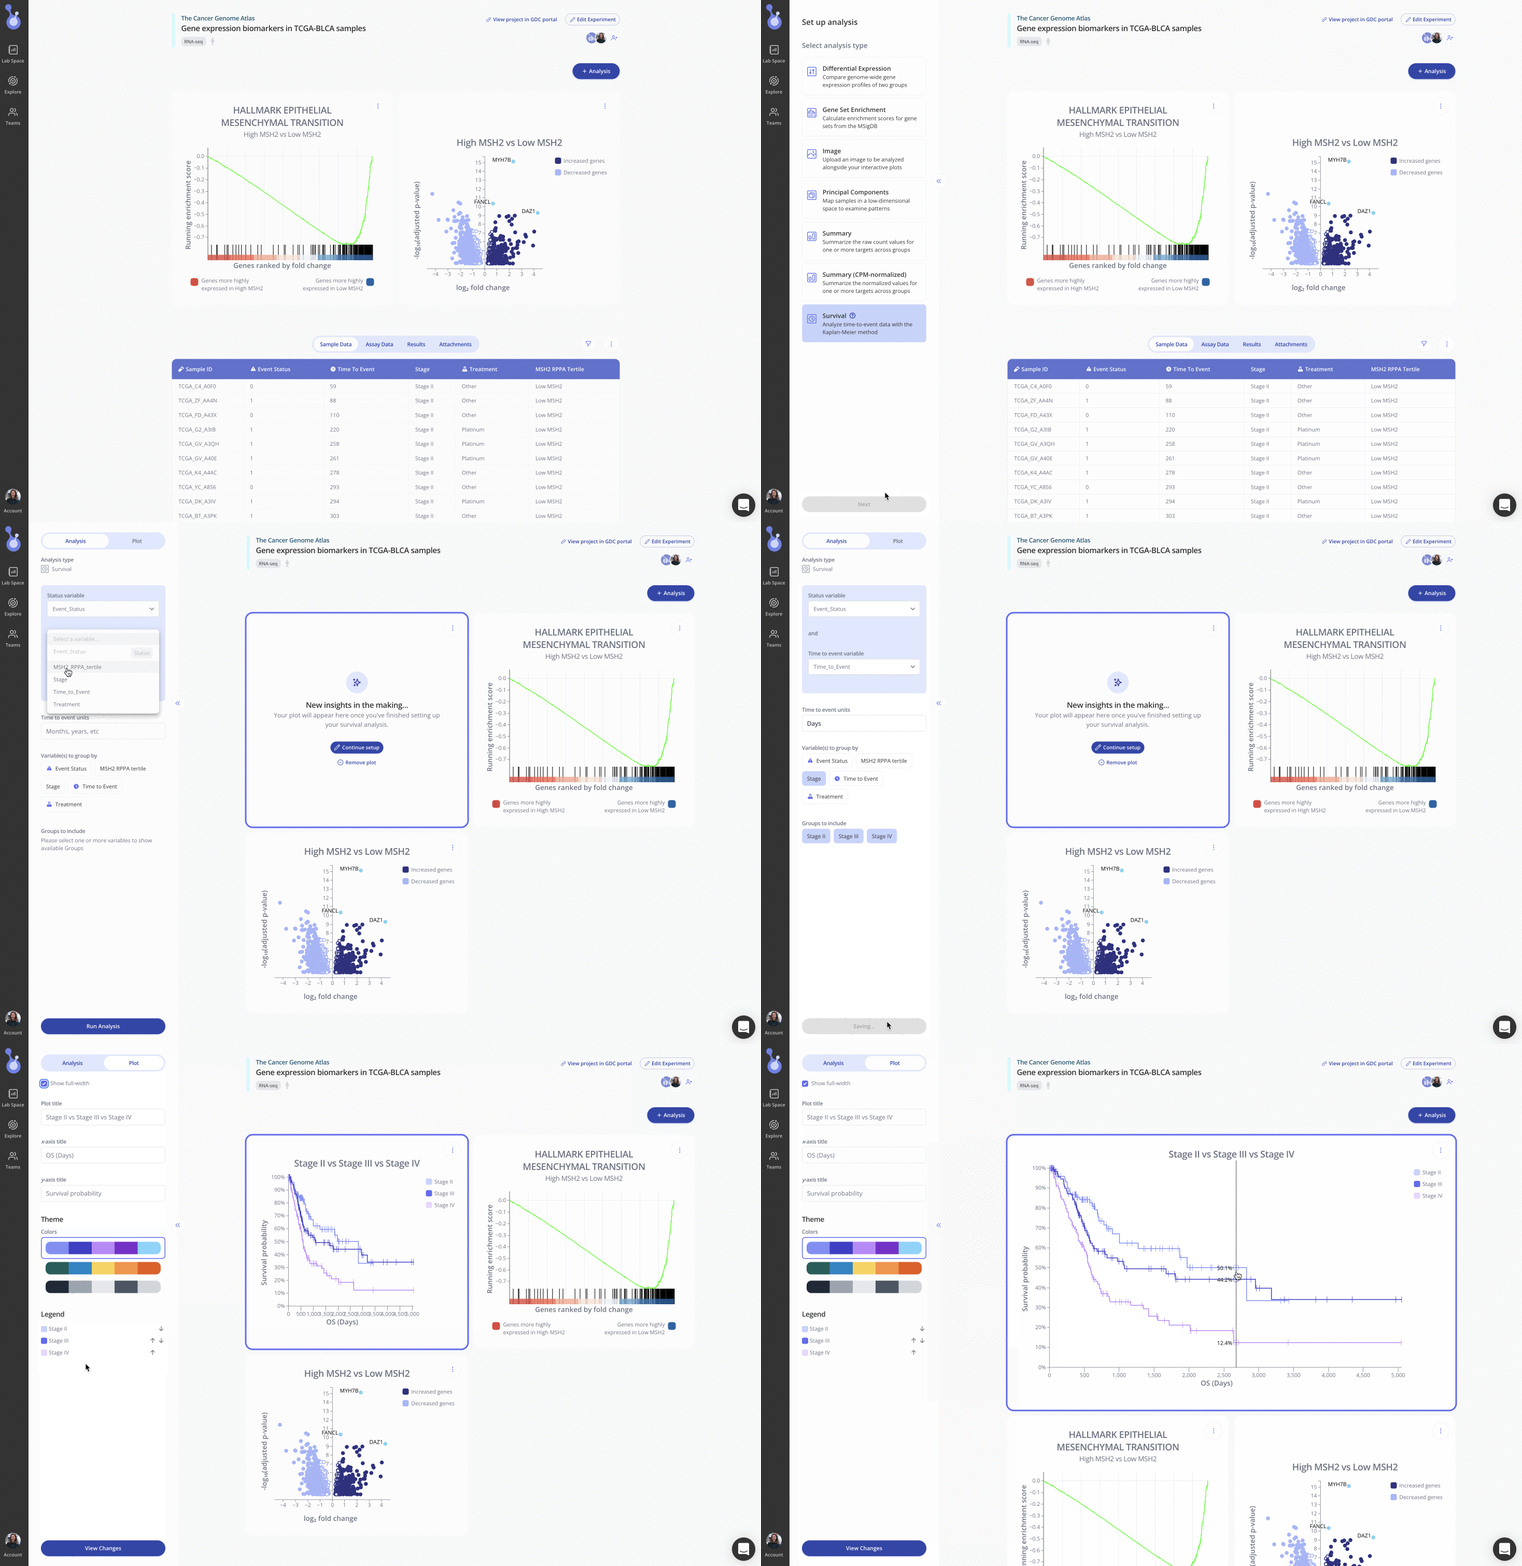
Using online tools: There are several online tools that allow you to create Kaplan-Meier curves without needing to install any software. These tools are often user-friendly and can be used by researchers with limited programming experience. Learn more about how to run survival analysis using the Kaplan-Meier method in Pluto here.
-
Manual calculation: Although this method is less commonly used in modern research, it is still possible to manually calculate the Kaplan-Meier curve. This method involves calculating the survival probability at each time point using the formula S(t) = S(t-1) x (1 - n(t)/d(t)), where S(t) is the survival probability at time t, S(t-1) is the survival probability at the previous time point, n(t) is the number of events (e.g., deaths) at time t, and d(t) is the number of individuals at risk at time t. Once the survival probability has been calculated for each time point, a stepwise function can be plotted to generate the Kaplan-Meier curve.
Regardless of the method used, it is important to include the number of individuals at risk at each time point and the number of events that occurred at each time point in the plot. This information is critical for interpreting the Kaplan-Meier curve and for assessing the significance of differences between survival curves.
Origin of Kaplan-Meier Curves
The Kaplan-Meier curve was first introduced by Edward L. Kaplan and Paul Meier in 1958 as a non-parametric method for estimating survival probability in medical research, particularly in cancer studies. The method was a significant improvement over previously used statistical methods, as it could handle incomplete or censored data, where some patients were still alive or lost to follow-up at the end of the study. Since then, Kaplan-Meier curves have become widely used in various fields of research, including clinical trials, epidemiology, and computational biology.
Example of survival analysis using Kaplan-Meier Curves in Pluto
Conclusion
In conclusion, Kaplan-Meier curves are a powerful tool in computational biology research, allowing researchers to analyze survival data in a variety of contexts. They provide a visual representation of survival data over time, revealing patterns and relationships that would be difficult to detect otherwise. As high-throughput data becomes increasingly important in biological research, Kaplan-Meier curves will continue to be an essential tool for identifying important genes and pathways associated with particular phenotypes or conditions.


